
Apache Spark WTF??? — 💣 Nuthin’ But A “GC” Thang 💥
When an exhausted GC meets a flood of data, there’s no mercy. Imagine one janitor, one mop, and a tsunami of Java objects. He’s collectin’…
“One, two, three and then the JVM explodes”
(adapted from “Nuthin’ but a “G” Thang” by Dr. Dre)
😩 When the Garbage Collector Gave Up on Us
It started like any other day in the life of a data hustler — caffeine flowing, PySpark firing up, and a stack of CSVs lookin’ like they’d been through a street brawl. We were cookin’ a feature generation pipeline, turning messy raw data into slick, ML-ready columns. Reading CSVs (some with +50k rows), filtering, joining, dropping in formulas — nothing exotic, nothing that should make a JVM throw a tantrum.
Then, outta nowhere, a unit test went rogue, and the console lit up like a crime scene.
Exception in thread "refresh progress" java.lang.OutOfMemoryError: GC overhead limit exceeded
    at scala.collection.convert.DecorateAsScala$$anonfun$asScalaBufferConverter$1.apply(DecorateAsScala.scala:49)
    at org.apache.spark.status.AppStatusListener.activeStages(AppStatusListener.scala:1044)
    at org.apache.spark.ui.ConsoleProgressBar.org$apache$spark$ui$ConsoleProgressBar$$refresh(ConsoleProgressBar.scala:64)
    ...
ERROR Utils: uncaught error in thread spark-listener-group-executorManagement, stopping SparkContext
java.lang.OutOfMemoryError: GC overhead limit exceeded
If you ain’t seen that error before, consider yourself lucky. Translation? “I’ve been grindin’ garbage for ages, and it’s all trash. I’m outta here.”
We were puzzled. Small datasets? Smooth sailing. Bump the size? Spark taps out — right after the feature transformations, just shy of the join.
Even weirder: dump those intermediate tables to disk, reload ’em, and Spark’s back in action. So the join wasn’t the snitch. Spark was choking earlier — but on what?
The formulas? Aggregations? Some sneaky serialization gangster lurking in a lazy transformation? One thing was clear: we had a full-blown mystery, and our Garbage Collector was waving the white flag like it just saw the 5–0 roll up.
🧠 Not All OutOfMemories Are Created Equal
You’d think “OutOfMemoryError” is self-explanatory — something ran outta memory, right? Well… yeah, kinda. But the JVM is a slick, nuanced player. When it runs dry, it don’t just throw up its hands and scream “I’m done!” — nah, it whispers exactly which kind of memory it ran out of. And trust me, there are at least eight distinct flavors of OOM, each with its own tragic backstory, street signs, and survival tips.
Let’s roll through ’em, one by one:
Java heap space: This is the JVM’s crib — where all your objects chill. Run outta room, and boom: classic OOM. Usual suspects? Memory leaks (collections that never shrink, references that ghost too late) or legit growth that outpaces your -Xmx. GC logs show the heap rising like skyscrapers, never dropping. Short-term hustle: give the heap more breathing room or patch those leaks.
GC overhead limit exceeded: Picture Sisyphus sweeping a sandstorm — yep, that’s your JVM. Heap’s stuffed, GC’s thrashing, CPU’s pinned, and barely a byte gets freed. Your GC threads are begging for mercy. Remedy? Bigger heap or a lighter workload before the JVM snaps.
Requested array size exceeds VM limit: You — or your code — asked for a monster array so huge it blows past the JVM’s addressable space (think new int[Integer.MAX_VALUE]). Sometimes accidental, sometimes math gone rogue. Stack trace points straight at the culprit. Fix it: no, you don’t need two billion elements. Chill.
Metaspace: This is where the JVM stashes class and method metadata. Fill it up, and bam — Metaspace OOM. Common in class-happy frameworks like Spring Boot or apps that never retire classloaders. Logs show frequent class unload attempts even when your heap’s healthy. Fix the leaks, or bump -XX:MaxMetaspaceSize. Don’t ignore the root cause, homes.
Unable to create new native thread: Not about the heap — this is JVM asking the OS for a new thread and the OS saying “Nah, fam.” Usually thread leaks or hitting OS limits (ulimit -u). Stack dumps reveal thousands of clones. Fix: stop spawning threads like there’s no tomorrow, or raise OS limits.
Direct buffer memory: Off-heap action. NIO and some frameworks like to dodge the garbage collector, but if you mismanage those buffers or -XX:MaxDirectMemorySize is too tight, boom—Direct Buffer OOM. Check DirectByteBuffer allocations and native memory stats (pmap, NMT). Fix leaks or give your off-heap space more room to breathe.
OS-level OOM Killer: Sometimes the JVM’s clean. It’s the OS pulling the plug — Linux OOM Killer swoops in when total memory runs dry, offing your JVM to save the rest. No Java stack trace, just a “Killed process… Out of memory” in dmesg. Solution? More RAM, tighter container limits, or less greedy neighbors.
OutOfMemoryError in Native Code (JNI): Java steps outta the sandbox into C/C++ territory. Native leaks or over-allocations crash your JVM or spawn mysterious OOMs. Stack traces show native frames. Detective work lives in gdb or valgrind. Fix: native code cleanup, memory free-ups, and maybe a stern talk with the JNI author.
😈 The Usual Suspects — And the Innocent Bystanders
Nothing kills a cluster’s vibe faster than seeing “GC overhead limit exceeded.” That’s the JVM dropping the mic and saying: “Yo, I’ve spent 98% of the last minute cleaning memory and freed basically nada. You’re on your own, fam.”
So, what really drives our poor Garbage Collector into burnout? Meet the usual suspects — straight from the streets of Spark.
Data Skew — The One Fat Partition That Ate Your Cluster
- What happens: Some join keys show up way too much — millions of rows with the same
customer_id. Spark tries to play fair and distribute data, but that one mega-key turns a partition into a black hole while the rest sit empty, sippin’ tea. - Symptoms: A few tasks crawl like snails or OOM, while the Spark UI flexes at 98–99%, like it’s all good.
- Why it kills GC: Executors juggling absurd loads fill the heap until the JVM whispers, “maybe if I clean harder…?” Spoiler: it don’t help.
- Fixes: Find the heavy hitters by grouping and sorting by count. Add some salt—a random integer column—to spread the weight. Let Spark’s Adaptive Query Execution handle the shuffle (
--conf spark.sql.adaptive.skewJoin.enabled=true). Or broadcast tiny tables (<100 MB) and dodge the chaos. - Why it wasn’t: Our dataset was synthetic; no skew to be found.
Inefficient Join Strategy — The Shuffle Strikes Back
- What happens: Spark can’t broadcast a table, so it goes full shuffle. Data flies across the cluster, network cables sweat bullets, and temp shuffle files balloon like bad tupperware.
- Symptoms: Massive shuffle volumes, excruciatingly slow execution, OOMs in the “Exchange” stage.
- Why it kills GC: Executors deserialize huge datasets into thousands of tiny objects — a GC nightmare that haunts your dreams.
- Fixes: Broadcast small tables, raise the broadcast threshold, and check your physical plan with
df.explain(True)to keep Spark playing clean. - Why it wasn’t: Join strategy already on point.
Poor Partitioning — Too Few or Too Many Guests
- What happens: Too few partitions and some tasks drown; too many partitions and the scheduler throws a rave that nobody asked for.
- Symptoms: Tasks choke on massive partitions, or the driver juggles hundreds of micro-tasks, slowing the whole operation.
- Why it kills GC: Executors either wrestle huge partitions or drown in tiny objects — heap suffers, GC can’t catch a break.
- Fixes: Repartition or coalesce after shuffles. Let AQE auto-tune. Target ~100–200 MB per partition (compressed).
- Why it wasn’t: Partitioning was balanced. Reducing shuffle partitions to 4 didn’t help, and maxing out at 4,000 let the join complete — only for later steps to stumble. 🤔
Accidental Data Explosion — The Cartesian Catastrophe
- What happens: Executors suddenly find themselves swimming in more rows than a rap crowd at a festival — thanks to a join gone wild.
- Symptoms: Slow tasks, choked executors, OOM errors popping off.
- Why it kills GC: Memory fills with mountains of objects, forcing the JVM to clean nonstop like a janitor on espresso.
- Fixes: Inspect the logical plan, ensure proper join keys/types, and count rows before/after joins to spot growth.
- Why it wasn’t: Writing tables to disk before the join made the test pass. No accidental explosion here.
Executor Memory Misconfiguration — The JVM’s “I Can’t Even” Moment
- What happens: Executors are starved for heap or Spark’s memory fractions are off. JVM spends all its time scrubbing instead of computing.
- Symptoms: Tasks crawl, GC spins like a broken record, OOMs appear like unwanted guests.
- Why it kills GC: A tight heap traps GC in a loop, leaving zero room for actual work.
- Fixes: Increase memory, tweak managed memory fractions, enable off-heap memory if needed.
- Why it wasn’t: With ~50K-row tables, bumping heap from 1 GB ➜ 2 GB didn’t budge the needle. Memory was already plenty.
🥷 Another Culprit … with Alibi
When an OutOfMemoryError hits, one of our sharpest tools is the heap dump analyzer — basically, a magnifying glass for your JVM’s wallet. VisualVM makes it easy: click, dump, explore, repeat. You get the real picture of who’s hoggin’ all the memory.
After taking a heap dump and counting objects by package, we got a suspicious lead:
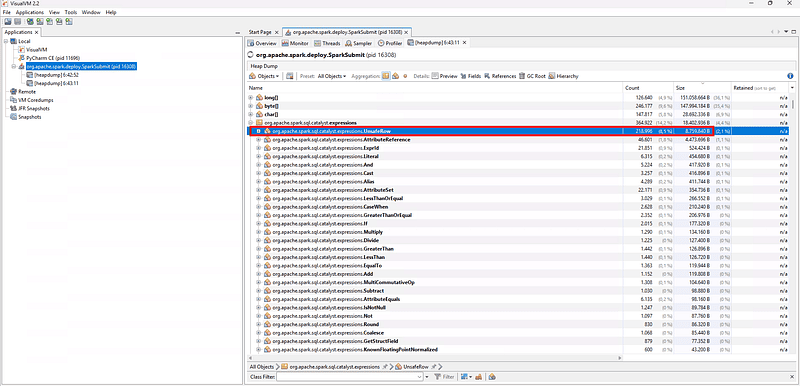
Most of the heap is hogged by org.apache.spark.sql.catalyst.expressions classes. Translation? Spark SQL’s expressions and plan objects are multiplying like bunnies. So who’s this shady UnsafeRow lurking in the shadows?
What Exactly Is UnsafeRow?
UnsafeRow is Spark’s low-level, binary hustler. While a normal JVM Row is like a standard apartment — one Java object per field — UnsafeRow is a tight, compact studio block of memory, on-heap or off-heap.
Why Spark rolls with it:
- JVM objects are expensive — metadata everywhere, nested objects causing GC drama.
- UnsafeRow flattens columns into one byte array, letting Spark:
- Avoid creating millions of tiny Java objects
- Serialize/deserialize rows lightning-fast
- Execute vectorized operations directly on raw bytes
- Cache data in a CPU-friendly, compact format
How and When UnsafeRow Hits the Scene
During SQL queries or DataFrame operations, Spark’s Catalyst optimizer cooks logical plans into physical plans:
- Catalyst generates bytecode for expressions and projections.
- Each row gets converted into an UnsafeRow.
- Column values (ints, doubles, strings) get encoded into a binary buffer, using offsets and bit-level magic.
Common spawn points:
- WholeStageCodegen: Catalyst’s own factories pumping out UnsafeRows.
- Shuffles and joins: Rows serialized for travel across network or disk.
- Caching/persistence: Data sitting tight in memory as UnsafeRow blocks.
Lifespan of an UnsafeRow:
- During query execution as intermediate data
- During shuffle stages for serialization/deserialization
- In broadcast joins holding broadcasted data
- In-memory caching (MEMORY_ONLY or MEMORY_AND_DISK)
They disappear once:
- The Spark stage completes and references vanish
- Cached/broadcast variables get unpersisted or evicted
✅ Pros
- High performance: compact, CPU-friendly layout, vectorized ops
- Low GC stress: fewer objects, less collection drama
- Efficient serialization: ready to shuffle or cache
- Codegen-friendly: Catalyst manipulates UnsafeRow directly
⚠️ Cons
- Hard to debug: raw bytes aren’t friendly
- Unsafe memory access: relies on low-level
sun.misc.Unsafe - Potential fragmentation: messy buffer management wastes space
- Not type-safe: encoding errors can silently corrupt data
Common Issues
- Memory leaks / retention: long-lived references keep UnsafeRows alive
- GC overhead limit exceeded: heap stressed by millions of these bad boys
- Executor OOMs: wide shuffles or big broadcasts
- Serialization mismatches: schema or version changes corrupt rows
Is UnsafeRow the Real Culprit?
So… can we blame UnsafeRow for our OOM? Maybe… or maybe it’s just the messenger showing where Spark’s memory squeeze is happening. A big shuffle or join can spawn millions of intermediate UnsafeRows and wreck your heap — but in our case?
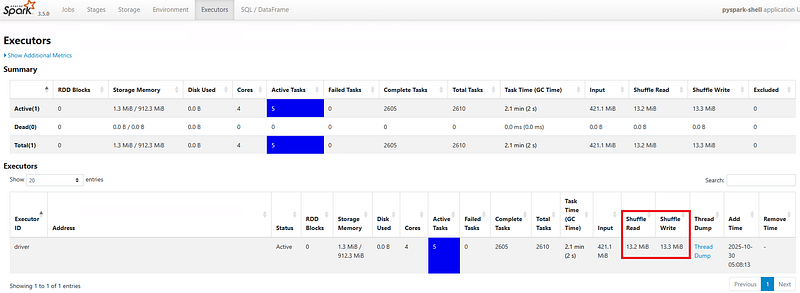
No massive shuffles here. UnsafeRow is just standing there, dropping hints, showing the pressure. The real question: is it the villain, or just the witness pointing to the real mastermind behind the GC meltdown? 😵💫
😎 Yeah, and I Don’t Quit
I’m not claiming to be the smartest cat in the room (and, let’s be real, not the dumbest either), but one thing has saved me in every Spark rabbit hole: stubbornness.
While trawling through a thread dump, I spotted an old fiend I’d met earlier this year: the Univocity CSV Reader. 😱
Here’s the backstory: last spring, I stumbled upon Zingg, an open-source ML framework for entity resolution — basically, linking records that refer to the same real-world entity, like customers or suppliers. It helps deduplicate, unify, and make sense of messy data across sources. Cool project, right? I got curious, dabbled a bit, and while profiling one of their tests, I noticed Spark grinding hard even on a small dataset. And no, it wasn’t Zingg’s fault — Spark was the one sweating.
Turns out, Spark leans on Univocity to parse CSVs. Normally, this library is slick and efficient. But here’s the kicker: Spark strips the end-of-line character before handing the text off. Univocity expects that EOL, and when it’s missing, it throws an exception — internally caught and silently ignored by Spark. Innocent-looking behavior? Maybe. But at scale, this silently wreaks havoc on the JVM’s performance — as it was shown last year in my article “Stranded On Dates Rows”.
I even opened SPARK-51579 on this, and, as usual in Spark-land, nobody’s shown interest yet.
Could this subtle CSV parsing quirk have hit our test? You bet. And yes… it can even trigger GC overhead explosions.
⚙️ How CSV Parsing Can Trigger GC and Performance Bottlenecks
Reading massive CSVs in Spark seems straightforward — but subtle parser behaviors can ruin your day. One silent killer? Exceptions.
Throwing and catching exceptions in Java is expensive, especially millions of times:
- Allocation of Exception Objects: Each thrown exception (like EOFException) is a full object, with stack trace. Multiply that by tens of millions of rows, and your heap is on fire.
- Stack Trace Generation: Capturing stack traces adds CPU and memory pressure, giving your GC extra work.
- Frequent Short-Lived Objects: These ephemeral exception objects live briefly in the young generation, triggering repeated minor GCs.
- Increased GC Overhead: High allocation rates push objects into the old generation, causing long GC pauses and fragmentation.
- CPU Overhead in Handling Exceptions: Catch paths, stack unwinding, cleanup — all expensive when repeated at scale.
- Optimization Interference: Exception-based control flow messes with JIT and whole-stage codegen, making the JVM work harder.
The net effect? Each row — or many rows — throws invisible tantrums, turning the parser into an “exception-based factory”. With large datasets, multiple partitions, and high concurrency, the JVM is slammed, manifesting as:
GC overhead limit exceedederrors- Long pauses
- Sluggish CSV loading
That also explains why small datasets or persisted intermediate results were fine — the JVM wasn’t slammed with exception spam.
🕵️♂️ The Full Investigation — Step by Step
Curious how I unraveled this sneaky CSV–GC bottleneck? In the coming weeks, I’ll share a step-by-step deep dive on debugging the JVM in PySpark, tracing exactly how Spark, Univocity, and our overworked Garbage Collector got themselves all tangled up. Think of it as a detective story — JVMs and CSVs instead of fedoras and trench coats — but just as thrilling.
👋 Greetings to my Hommies
Shout-out to all my colleagues on the GDP project! A special thanks to Carmen Rosa Lopez for all her support while I was deep in the trenches investigating this issue — you rock.
I also want to give a shout-out to Sonal Goyal and her team at Zingg: keep crushing it! I’m excited to jump in on any future mysteries — especially the cool, mind-bending ones that call for a bit of detective work.
“So just chill, ’til the JVM explodes”
(adapted from “Nuthin’ but a “G” Thang” by Dr. Dre)

Once I blamed UnsafeRow for the chaos. Today? Just another epic t-shirt idea.😅