
🕺Greased Reyden⚡
Spark, Photon, Milliseconds, Massive Concurrency, and the Mysterious Machinery under the Lakehouse//RT Hood
⚠️ Disclosure: I was recently honored as a Databricks MVP*, but Databricks did not review or sponsor this article. Everything factual below comes from public material available as of* August 20, 2026*; where the evidence stops, I say so.*
Databricks already had Photon: native C++, vectorized execution, and years of work making Spark SQL go vroom.
Quick warning: this is not another Photon article. This time, Photon is the control group.
Now Databricks has rolled Reyden into the garage: the new engine behind Lakehouse//RT, built for low-latency, high-concurrency reads over supported Delta and Iceberg data.
So the real question is: If Photon was already fast, what was still worth rebuilding once “fast” started meaning milliseconds?
Grab the wrench. 🔧
Greased Reyden: tuning milliseconds until the metrics start singing.
“This cluster could be systematic.
Hydromatic. Ultramatic.
Why, it could be Greased Reyden”
(“Greased Lightnin” from Grease)
🚦 The Race Reyden Was Actually Built For
The problem was never simply: SQL is slow. Photon had already attacked that problem with a very large hammer.
The newer problem is: How do I serve thousands of analytical requests from dashboards, applications and agents without building another bloody database next to the lakehouse?
The traditional architecture is perfectly rational:
Delta / Iceberg
      ↓
CDC / replication / materialization
      ↓
ClickHouse / Pinot / Druid / another serving DB
      ↓
application / dashboard / API
A specialized serving system buys low latency, predictable tails, indexing and workload isolation.
It also charges rent:
- another physical representation,
- freshness lag,
- CDC pipelines,
- schema evolution,
- another operational surface,
- another cost center,
- and potentially another governance surface.
That is why the promise behind the Lakehouse//RT launch is much bigger than: query became 20% faster. It’s closer to: perhaps we can delete an architectural tier.
Keep the authoritative analytical data in supported Unity Catalog Delta/Iceberg tables and serve it directly with a specialized low-latency engine.
📌 Reyden’s real opponent is not Photon. It’s the reason people deployed a serving database in the first place.
There’s an important boundary, though.
Lakehouse//RT is read-only today. It doesn’t suddenly become your transactional application database.
Databricks’ own Digital Product Passport accelerator is a nice reality check: Lakebase handles operational reads/writes, while Reyden is suggested as an optional high-concurrency serving path for sub-second QR lookups.
So even Databricks’ own field architecture says:
✅ Use the right engine for the right race ✅
not:
❌ There can be only one database ❌
And there is a wonderfully recursive joke here: while Reyden is meant to attack your second serving system, Reynold Xin has publicly discussed in his Latent Space interview the classic second-system effect as one of the dangers of rebuilding a mature analytical engine from scratch.
Database engineering has achieved recursion.
🔧 Photon Is the Control Group — And Reyden Is Still Mostly Hood-Closed
Photon in actual 90 Seconds
Photon started as a native C++ vectorized engine integrated into the Spark/Databricks world.
The original SIGMOD paper describes Spark/DBR plans being converted into Photon-compatible fragments and executed through the native library.
Very roughly:
SQL / DataFrame
      ↓
Spark / Databricks planning
      ↓
distributed execution
      ↓
Photon-native work
      ↓
🔥🔥🔥🔥🔥🔥🔥🔥
One useful correction to the folklore: the paper measured the JNI boundary and concluded that, when amortized over batches, it was not a significant execution bottleneck.
So JNI bad => Reyden is not architecture. It’s a bumper sticker.
Photon also grew far beyond “some fast C++ operators.” Databricks’ 2024 VLDB paper describes it as a full distributed query engine with analysis, optimization, AQE, distributed scheduling and native execution.
Which is exactly why Photon is our control group.
Native code? Already had it.
Vectorization? Already had it.
AQE? Already had it.
Distributed native execution? Already had it.
So Reyden’s interesting bit has to be more specific than:
They made Spark native
What we actually Know about Reyden
The current Lakehouse//RT documentation describes a Beta specialized serverless SQL warehouse for low-latency, high-concurrency read workloads over supported Unity Catalog Delta/Iceberg data.
Databricks’ launch material gives us one especially interesting architectural phrase: fully asynchronous execution model
That’s a useful clue. It’s not a component diagram.
Publicly, the server-side implementation remains mostly hood-closed. We do not have a reliable published blueprint for its planner topology, scheduling model, runtime adaptation, exchange machinery, cache hierarchy, or implementation language.
And that is fine. The closed hood is the investigation.
Wrong RT, Grease Monkey
One naming trap is worth killing early: Lakehouse//RT is not Spark Structured Streaming Real-Time Mode.
Spark RTM is a separate Structured Streaming execution mode whose RTM documentation describes public machinery such as long-running batches and streaming shuffle. Lakehouse//RT is the SQL warehouse powered by Reyden.
Same letters ≠ same architecture. Until Databricks publishes evidence connecting them, they stay on separate tables.
“From Scratch” is Public. The Family Tree is Not.
The most interesting public architecture clues come from Reynold Xin himself.
In his June Latent Space interview, Xin says the team chose to start from scratch, after a decade of watching mature analytical systems accumulate layers of abstractions and compromises.
That’s a strong statement about the design reset. It does not establish:
- implementation language,
- planner lineage,
- scheduler lineage,
- operator lineage,
- Photon reuse or non-reuse.
So I am not going to infer any of them.
More interestingly, Xin describes building what he calls a “factory for building the database” around roughly a decade of sampled production query traces.
Those traces feed an ML model intended to predict how different algorithms and implementations behave under different conditions.
That can influence both:
runtime choices
      +
implementation-time engineering choices
For the same logical operation, different implementations may win depending on scale, cardinality, sparsity, latency-versus-throughput trade-offs, or data distribution.
Xin’s wonderfully database-nerdy example is an aggregation with a tiny dense grouping-key domain: a direct array lookup may beat a general-purpose hash table.
The important idea is not: Reyden uses arrays.
It is: The best implementation of an operation can depend on the data — and Reyden’s design explicitly tries to use historical workload evidence to choose better implementations.
That is much more interesting than the popular phrase “factory of engines.”
Narrow Product Today, Bigger Ambition Tomorrow
One last correction prevents us from learning the wrong lesson from the Beta.
The current Lakehouse//RT endpoint is narrow:
- read-oriented,
- controlled data surface,
- controlled serverless environment,
- specialized low-latency workload shape.
But Databricks has publicly described Reyden’s ambition as much broader.
Ali Ghodsi explains REYnold’s Dream ENgine as the dream of one engine spanning ultra-low-latency BI and massive-scale warehousing.
Xin similarly describes the rollout as incremental: ship the low-latency endpoint first rather than wait years for the whole engine envelope.
So:
Lakehouse//RT Beta today
        =
narrow serving-shaped surface
doesn’t necessarily mean:
Reyden forever
        =
tiny-query specialist
That’s the real wager.
📌 Can Databricks start with milliseconds… and widen the envelope without giving the milliseconds back?
⚙️ When Milliseconds Make the Machinery the Hot Path
A query does not begin at a hash join. It has to survive something like:
client
  ↓
network / protocol
  ↓
auth / session
  ↓
metadata
  ↓
analysis + planning
  ↓
scheduling
  ↓
execution
  ↓
result transport
  ↓
client
For a 30-second query, 20 ms of surrounding machinery is noise.
For a 30-ms serving target, 20 ms is the problem.
And this is not just systems-theory fan fiction. Databricks engineer Mehmet Can Kurt publicly described his DBSQL control-plane team as working toward thousands of QPS with only a few milliseconds of latency. That tells us nothing about Reyden’s joins or scheduler, but it does show that the machinery around execution became a first-class performance target.
So my working theory is not: Reyden invented joins 100× faster than Photon.
It is: Reyden may be what happens when the entire query lifecycle is redesigned around a millisecond budget.
That’s inference. But it fits the problem rather well.
Planning Doesn’t Magically Disappear
Tiny queries still need pruning, predicates, join decisions, parallelism, aggregation choices, and perhaps runtime adaptation.
So “they removed Spark” is too vague to teach us much. Spark bundles many responsibilities: APIs, semantics, Catalyst, planning, scheduling, shuffle, execution, connectors, user code, and compatibility baggage.
The useful question is simpler: Which responsibilities still exist, and which ones were redesigned for a much tighter latency budget?
Public evidence doesn’t yet tell us.
“Fully Asynchronous” — Async What?
Databricks publicly describes Reyden as having a fully asynchronous execution model.
That phrase may matter more than it first appears.
Parallelism looks roughly like:
CPU 1 ➔ A
CPU 2 ➔ B
Asynchrony is more like:
A runs
A waits
B uses the resource
A becomes ready
A resumes
At huge concurrency, the important trick is not merely making work fast. It’s making waiting cheap.
Queries can potentially wait on:
- storage,
- metadata,
- network,
- remote work,
- capacity,
- result delivery.
If every waiting request ties up heavyweight resources, high concurrency gets expensive very quickly.
But we should stop there.
“Fully asynchronous” doesn’t publicly tell us whether Reyden uses async I/O, fibers, coroutines, continuations, operator pipelines, query multiplexing, or some particularly caffeinated squirrel.
Those mechanics remain hood-closed.
Also, don’t confuse this with the Statement Execution API being asynchronous from the client’s perspective.
Same adjective. Different layer.
QPS Is Not Latency, and p50 Is Not p99
For a serving engine, three numbers tell three different stories:
latency        → how long one query takes
throughput/QPS → how many queries finish per second
tail latency   → how bad things get for the unlucky queries
p50 is the median.
p99 is the ugly end of the queue.
A system can have:
- beautiful p50,
- impressive QPS,
- absolutely cursed p99.
It can also sustain huge throughput while requests quietly pile up in queues.
And something that flies at concurrency 1 can turn into soup when 1,000 clients arrive together.
Databricks publicly reports sub-100-ms latency at 12,000 QPS in its Lakehouse//RT benchmark material.
The interesting part is not only the number 12,000. It’s how much work must coexist inside the system to sustain it.
Little’s Law gives us a useful mental model:
requests in flight
    =
requests per second × average residence time
If a system sustains 12,000 QPS and requests spend 50 ms on average inside it:
12,000 × 0.05 ≈ 600Roughly 600 queries are alive at once.
At 100 ms average residence time:
12,000 × 0.10 ≈ 1,200Now roughly 1,200 queries are simultaneously in flight.
Those are illustrations, not claims about Databricks’ actual mean latency. And they definitely do not mean 600 or 1,200 CPUs.
Those queries may be:
- executing,
- waiting for I/O,
- waiting for metadata,
- waiting for remote work,
- queued for capacity,
- sending results.
📌 High-QPS serving is not merely about executing each query quickly. It’s about keeping hundreds or thousands of partially active queries cheap while they compete, wait, and resume — without turning p99 into a crime scene.
That’s where the garage starts getting interesting.
🧴 The Grease: Layout, Cache, Freshness and Transport
A 10-ms engine cannot repeal object-storage physics. If every query needs a cold multi-gigabyte scan, hundreds of remote files, and a fat shuffle, 10 ms is not a universal expectation.
The better question is: How little physical work can Reyden make each request perform?
“No Second Copy” does not Mean “No Acceleration State”
One misconception needs killing immediately. This is almost certainly the wrong mental model:
query
  ↓
random cold object-store reads
  ↓
10 ms
Keeping Delta/Iceberg as the source of truth is perfectly compatible with:
- metadata caches,
- I/O caches,
- statistics,
- prefetched data,
- runtime state,
- derived materializations,
- other acceleration machinery Databricks has not publicly documented.
The current RT guidance even recommends materialized views when expensive queries need pre-aggregation.
That creates derived state.
It doesn’t create another independently operated serving database with its own ingestion, security, and operational plane.
That’s not cheating. That’s database engineering.
So the interesting question is not: Does Reyden use grease?
Of course the machine is greased.
The interesting question is: What exactly has been greased — and how much of the old serving architecture does that let us remove?
A Huge Table Can still Be a Tiny Query
A query against a 4-TB table is not necessarily a 4-TB query. These can hit the same logical table:
logical table: 4 TB
physical bytes read: 80 KB
and:
logical table: 4 TB
physical bytes read: 2.7 TB
Same table. Completely different race.
The first query may prune almost everything and touch a tiny handful of columns and files. The second may actually have to scan a large fraction of the data.
That distinction matters because the current Lakehouse//RT guidance is explicit about conditions that help low-latency performance:
- selective predicates,
- reading only the columns you need,
- supported Unity Catalog managed tables,
- Predictive Optimization / Liquid Clustering,
- materialized views when heavier queries need pre-aggregation.
So this model is too simple:
performance = engineA better one is:
performance = engine
              + data layout
              + pruning
              + metadata
              + locality
              + workload shape
Which is why a chart saying “10 ms on a 4-TB table” doesn’t yet tell you much.
The useful follow-up question is: How much of those 4 TB did the query actually have to touch?
📌 At millisecond scale, logical table size is mostly a headline; physical work is the benchmark.
“The Cache” is not One Thing
Another easy mistake is treating all warm-state effects as one magical cache. At minimum, separate:
result cache
metadata / statistics state
I/O / data cache
runtime state
possibly other acceleration state ❓
Those layers produce very different conclusions.
- A result cache can make an identical query nearly disappear.
- Metadata can avoid expensive file discovery.
- I/O caching can keep hot blocks away from object storage.
- Runtime structures can eliminate repeated setup work.
None of that makes a benchmark illegitimate. It tells you what you benchmarked.
Databricks’ query-history system table exposes clues such as cache usage, bytes/files read, pruning, shuffle, compilation, queueing, and execution time.
So instead of saying: Wow, Reyden is insanely fast!
Ask: What work disappeared?
That’s where the interesting engineering usually lives.
Real-Time Has Two Speedometers
Now for the part marketing slides love to blur:
query latency: 15 ms
data freshness: ???
Those are different clocks.
A newly written row has to travel through something like:
write
  ↓
Delta / Iceberg commit
  ↓
engine discovers new table state
  ↓
next query can see it
The current RT documentation talks about querying fresh lakehouse data, but it does not currently give us a formal commit-to-visibility SLA.
So:
10-ms query ≠ 10-ms-old dataFor application serving, that distinction can matter more than shaving another five milliseconds from execution.
This is also one of the better questions raised in SingleStore’s response: if the write path and serving path are separate, what are the visibility and consistency semantics?
Their speculative answers about Reyden internals remain competitor speculation. The question itself is excellent.
New Engine, New Transmission
Lakehouse//RT currently requires the Statement Execution API path rather than legacy Thrift.
The RT documentation describes supported connector modes, including the kernel path used by Python and Node.js.
That matters because once server work approaches tens of milliseconds, the boring stuff suddenly stops being boring:
- connection setup,
- network RTT,
- polling,
- serialization,
- result transport,
- client runtime.
There’s also a lovely bit of archaeological evidence here.
Databricks’ public JDBC release notes show Statement Execution API work aimed at reducing latency for short queries before Lakehouse//RT’s public launch.
Databricks was already attacking tiny-query transport overhead before Reyden became everybody’s favorite conference mystery.
That supports the millisecond-budget story. It doesn’t prove SEA was invented for Reyden.
The Rust Trap
The public Python connector and Node.js driver contain native Rust client-side kernel machinery, and the public Go driver contains a Reyden-specific E2E test whose comment calls Reyden the***“SEA reference engine.”***
Interesting breadcrumbs. But:
Rust client ≠ Rust serverI still have not found a strong public Databricks source establishing Reyden’s server implementation language. So the Rust client is not evidence that the server is written in Rust.
The hood remains closed.
What Reyden Gets to Refuse
Specialization is not only about what an engine can do. Sometimes the interesting part is what it is allowed to say: Nope. 👎
The current Lakehouse//RT Beta is deliberately narrower than normal Databricks SQL.
Today, that means no normal write/ETL path such as:
INSERT/UPDATE/DELETE/MERGE❌- DDL / CTAS ❌
OPTIMIZE/VACUUM/ANALYZE❌- Python UDFs ❌
- arbitrary connectors / raw files ❌
- query federation ❌
There are also current governance and connectivity gaps, including ABAC features such as row-level security and column masking, plus several networking/compliance capabilities available elsewhere in the platform.
That sounds like a weakness. Architecturally, it is also freedom.
A general Spark runtime has to survive things like:
SQL
DataFrames
Python
Scala / JVM
UDFs
writes
streaming
connectors
arbitrary user code
legacy behavior
Lakehouse//RT currently gets something much cleaner:
controlled SQL reads
controlled table formats
controlled catalog
controlled transport
controlled serverless runtime
Every thing an engine doesn’t have to support potentially removes branches, fallback paths, runtime uncertainty, and compatibility baggage.
That can matter enormously when milliseconds count.
Just remember the earlier distinction:
📌 These restrictions describe the current Beta surface, not necessarily Reyden’s final ambition.
Unity Catalog and Serverless Are Part of the Bargain
The serving path stays inside the Unity Catalog world rather than creating another independent database security plane, but the current Beta doesn’t have full governance feature parity; the present RT support matrix still excludes features such as row-level security and column masking.
Lakehouse//RT is also serverless-only. That may be more than packaging. If you want to control warm state, placement, bursts, scheduling, and thousands of concurrent requests, owning the compute lifecycle gives the platform more freedom than customer-shaped clusters.
That is inference, but it fits the bargain:
📌 Controlled workload + controlled data surface + controlled transport + controlled infrastructure in exchange for ridiculous latency targets.
The hard part comes later: preserving that latency as the product surface broadens.
🧨 Benchmarketing — Spectacular Numbers, Incomplete Dyno Sheet
Now we reach the part that started a small database street fight.
Databricks’ Lakehouse//RT launch reports:
- latency as low as roughly 10 ms on some smaller-data workloads,
- sub-100-ms performance on larger datasets,
- sub-100-ms latency at 12,000 QPS on what it calls standard analytical benchmarks.
It also shows TPC-H-based scaling tests up to roughly a terabyte and harder TPC-DS-based workloads.
Those are impressive Databricks-published results. They are not independently reproducible benchmarks.
And that distinction matters.
The Missing Dyno Sheet
To reproduce a performance claim properly, I would want boring things such as:
- exact configuration,
- cloud and region,
- query corpus,
- parameter distribution,
- open-loop vs closed-loop load,
- connection strategy,
- warm-up,
- cache assumptions,
- table layout,
- file sizes/count,
- p50 / p95 / p99,
- errors / rejections / timeouts,
- achieved QPS,
- cost.
The launch material gives us workloads and charts, but not enough of that package to rebuild the exact race.
That doesn’t mean: The benchmark is fake.
It means: The public benchmark is under-specified.
Very different accusation.
“But TPC-H SF1 Is Only 1 GB!”
Yes. And? 🧐
A small warm dataset cannot prove performance on giant cold scans, but it can stress exactly the things a serving engine cares about: fixed query overhead, scheduling, concurrency, connection handling, locality, and resource multiplexing.
So the right question is not: Is 1 GB too small?
It is: What is this benchmark supposed to measure?
Databricks also published larger TPC-H-based and TPC-DS-based tests, so portraying the entire Reyden story as a 1-GB benchmark is misleading.
And one terminology nit matters: a TPC-H-based test is not automatically an official TPC-H benchmark submission. The TPC-H specification is a good reminder that formal TPC results come with methodology and disclosure requirements.
ClickHouse Arrives With a Wrench
ClickHouse’s response argues that the Databricks comparison does not disclose enough Reyden hardware, configuration, cache behavior, methodology, or cost to reproduce the head-to-head.
It then runs the identifiable TPC-H SF1/Q6-style workload on ClickHouse and publishes its own throughput/latency numbers. Useful evidence about ClickHouse — but not a disclosed apples-to-apples Reyden comparison.
ClickHouse itself makes that point: the unknown Reyden configuration prevents a clean side-by-side comparison.
That caveat is more valuable than the flame war.
Snowflake Enters the Garage
Snowflake attacks a different variable: configuration. It argues that Databricks used a small dataset, a repeatedly executed query/predicate, and a warehouse configuration that did not use the horizontal scaling Snowflake would normally choose for that workload, then publishes its own reruns.
Again, those are Snowflake-run counterbenchmarks compared with Databricks-published Reyden numbers.
So ClickHouse did not “disprove Reyden.” Snowflake did not “disprove Reyden.” And Databricks’ charts do not independently prove universal superiority over either competitor.
📌 Change the configuration, workload, cache state, layout, or load generator and you can change the benchmark story dramatically.
Welcome to databases.
The Competitors Are Still Asking Good Questions
StarTree’s response makes two points I particularly like for serving workloads:
Where is p99?
What did it cost?
Because the production metric is rarely:
maximum QPSIt’s closer to:
maximum successful QPS
while p99 < SLA
at $X
Also worth killing is the lazy comparison that says: Reyden queries open lakehouse data while every competitor necessarily requires a separate proprietary copy.
Modern systems including ClickHouse and StarTree increasingly support direct access to Delta/Iceberg-style lakehouse data too.
The more useful comparison is what happens when different engines query the same lakehouse data directly—latency, concurrency, and how that compares with each engine’s native storage path.
So the architectural differences are becoming more subtle:
📌 What acceleration state do you build, who owns the physical layout, how fresh is it, and how much operational complexity do you accept?
Much more interesting than: zero copy good, copy bad.
So… Do I Believe the 12,000 QPS?
I believe Databricks reported it.
I also think a new engine capable of delivering those latency/concurrency characteristics directly over governed lakehouse data would be a genuinely important piece of engineering.
But I want the dyno sheet.
Not because I think the car is fake. Because 12,000 QPS at sub-100 ms is exactly the kind of number that deserves an experiment somebody else can rerun.
Being excited about Reyden and asking for reproducible benchmarks are not opposing positions. Especially when the hood is still closed.
🎉 Cheer for the engineering.
🔧 Ask to see the wrench marks.
🔬 The Dyno Test I Would Actually Trust
Complaining about benchmarks is easy.
So what would a useful Reyden benchmark actually look like?
📌 First rule: Do not compress three different races into one heroic QPS number.
Race 1 — The Latency Floor
Start with trivial and highly selective queries.
The goal is not to test scanning power. It’s to discover how much latency remains when useful execution approaches zero.
Measure separately:
- client round trip,
- planning / compilation,
- queueing,
- execution,
- result fetch,
- first row,
- final row.
Databricks’ query-history telemetry is useful here, but there is a trap: total_duration_ms excludes result-fetch time.
So server latency and application-visible latency are not the same clock.
Race 2 — Serving Under Load
Now make it ugly.
Use:
- randomized predicates,
- a realistic query mix,
- enough concurrency to expose queueing,
- preferably open-loop load.
Closed-loop testing does this:
send query
wait
send query
wait
When the system slows down, the client conveniently slows down too.
Open-loop testing keeps arrivals coming. That’s how you discover whether:
p50 = gorgeous
p99 = small electrical fire
Report:
- requested QPS,
- achieved QPS,
- successful QPS,
- rejections,
- timeouts,
- p50 / p95 / p99,
- queue time,
- cost.
Because “we sent 12,000 QPS” and “the system successfully sustained 12,000 QPS inside the SLA” are very different sentences.
Race 3 — Make the Data Fight Back
Then scale the actual work from gigabytes into terabytes. Mix selective lookups with scans, joins, aggregation, skew, and shuffle. Push beyond plausible cache.
Report the physical reality: bytes/files read, pruning, shuffle, spill, latency, tail latency, and cost.
The point is not to punish the engine with giant scans. It’s to make the benchmark reveal what kind of work produced the latency number.
🟨 Different Garages, Different Bargains
Reyden makes more sense when you compare it with systems that made different architectural bets.
Not better or worse. Different bargains.
ClickHouse — Same Road, Then Home Track
A fair ClickHouse comparison really needs two races.
1. Same Road. Where practical:
same Delta / Iceberg data
        ↙       ↘
    Reyden    ClickHouse
This asks: Who serves the same open lakehouse data better?
2. Home Track. Then let each system use its native strengths:
Reyden
+ optimized Delta / Iceberg layout

🆚

ClickHouse
+ [MergeTree]
+ ordering
+ indexes
+ projections
This asks the more practical production question: What is the best result each architecture can deliver, and what does it cost operationally?
On its home track, ClickHouse controls much more of the physical serving stack:
- ordering,
- primary indexes,
- data skipping,
- projections,
- materialized views,
- compression,
- background storage organization.
That’s an enormous advantage when the goal is predictable low-latency serving. Very roughly:
ClickHouse

SQL
 ↓
optimizer
 ↓
native execution
 ↓
native storage + indexes
Reyden is making a different bet:
SQL
 ↓
Reyden
 ↓
Delta / Iceberg
 ↓
object storage
Its promise is not simply: beat a purpose-built serving database on its own turf.
It is: make the existing lakehouse source of truth fast enough that you may not need that second serving representation at all.
But the comparison is no longer binary. Modern ClickHouse can also query lakehouse data directly. That’s exactly why Same Road matters too.
The useful question becomes: How much performance does owning the physical serving layout still buy — and when is that advantage worth the additional storage, tuning, and operational machinery?
Sail — Compatibility is Expensive
Sail is useful for a different reason. It is not evidence about Reyden; it is an open-source X-ray of what happens when you replace Spark’s implementation while preserving much of the Spark-facing SQL/DataFrame contract.
Its query-planning documentation exposes the familiar machinery: semantics, logical and physical planning, extensions, shuffle stages, distributed tasks, and workers.
That gives us four useful philosophies:
- Photon — keep the Spark-shaped world and native-accelerate it.
- Sail — replace much of the implementation while preserving the Spark-facing contract.
- Lakehouse//RT today — constrain the serving surface and chase milliseconds.
- ClickHouse — control enough of execution and storage to optimize the serving stack together.
Compatibility costs complexity. Specialization costs breadth. Storage ownership costs another architectural commitment.
The Real Architectural Bet
Photon, Sail, ClickHouse, and Reyden are not merely competing on who executes SQL faster.
They choose different places to spend complexity:
Photon     ➔ compatibility
Sail       ➔ replacement + compatibility
ClickHouse ➔ physical control
Reyden     ➔ specialization + controlled serving path
Each bargain buys something.
Each makes something else harder.
For Reyden, the difficult part is not proving that a constrained serving endpoint can be fast. It’s what happens as that constraint disappears.
How much generality can you add before the machinery you deliberately escaped starts creeping back in?
That’s the real architectural gamble. And the real garage fight.
🔬 Reconstructing Reyden From the Tire Marks
Now we can finally draw the dangerous diagram. Not the Reyden architecture. The minimum public-evidence model I am willing to draw is this:
              CLIENT
                 │
                 ▼
       Statement Execution API
   (client kernel on some drivers)
                 │
                 ▼
   ┌────────────────────────────┐
   │ Databricks platform        │
   │ auth / session / UC        │
   └─────────────┬──────────────┘
                 │
                 ▼
      parse / analysis / plan ?
                 │
                 ▼
┌───────────────────────────────────┐
│ REYDEN                            │
│                                   │
│ fully asynchronous execution [OK] │
│ scheduler / multiplexing      [?] │
│ runtime adaptation            [?] │
│ exchanges / distributed work  [?] │
│ operator implementations      [?] │
└────────────────┬──────────────────┘
                 │
        cache / metadata / state ?
                 │
                 ▼
      supported UC Delta / Iceberg
                 │
                 ▼
           object storage
The current Lakehouse//RT docs establish the product edges:
- serverless,
- low-latency/high-concurrency SQL reads,
- supported Unity Catalog Delta/Iceberg data.
Databricks also publicly describes Reyden as having a fully asynchronous execution model.
Most of what happens inside the big box remains undocumented. And that’s where restraint matters.
The Other Diagram we Can Draw
Xin’s Latent Space interview gives us one unusually concrete design clue:
years of production query traces
              ↓
      sampled workload data
              ↓
ML model predicting which
algorithms / implementations win
              ↓
       ┌──────┴──────┐
       ↓             ↓
runtime choices   engineering choices
That much is public. What is not public is where this machinery sits.
Planner?
Runtime?
Operator dispatch?
Offline engineering loop?
Some combination?
We don’t know. So I would resist turning it into “Reyden is an AI query optimizer” or “Reyden is a factory of engines.”
The real public story is stranger and better:
📌 Databricks says it used a decade of production workload evidence to rethink how implementations are chosen and built.
What we still do not Know
The important unknowns are still important precisely because they remain unknown:
- planner topology ❓
- scheduler model ❓
- adaptation strategy ❓
- exchange / shuffle design ❓
- cache / acceleration state ❓
- server implementation language ❓
- exact async mechanics ❓
That’s not a reason to invent answers. It’s a reason to keep investigating.
📌 Observed behavior gives us tire marks. It does not give us the engine blueprint.
⚡ Was Spark Actually the Problem?
After all this, it would be easy to conclude: See? Spark was slow.
Satisfying. Also wrong.
The better question is: What becomes worth redesigning when a general-purpose analytical engine is already fast, but the new target is tens of milliseconds under heavy concurrency?
My current thesis is that Photon made the inner execution path fast enough for the surrounding machinery to become impossible to ignore.
Planning.
Scheduling.
Waiting.
Transport.
Resource ownership.
Locality.
Concurrency.
The things that barely mattered when useful work took seconds can dominate when the whole request has a 20–50 ms budget.
That’s why the benchmark I ultimately care about is not one spectacular query or one enormous QPS number.
It is: Can Reyden keep tiny-query p99 tiny while bigger analytical work enters the room — on fresh lakehouse data, at high concurrency, and at a sensible cost?
If Databricks eventually pulls that off, the interesting conclusion will not be: Spark lost.
It will be: The definition of “one analytical engine” got much more ambitious.
🎶 Final Scene — Greased Reyden
Photon: “How much horsepower?”
Reyden: “Wrong benchmark.”
Green light. Ten thousand queries arrive. ⚡
Photon proved that the Spark-shaped analytical world could become ferociously fast.
Reyden is a different wager: start from a millisecond-scale serving problem, rethink enough machinery to make huge concurrency practical, then widen the engine toward larger analytical workloads without giving the milliseconds back.
The hood is still partly closed, and the famous benchmark still lacks enough public detail to reconstruct the race independently.
But the interesting question was never: Is Reyden faster than Photon?
It was: What becomes worth rebuilding once Photon has already made execution fast?
Now we know which bolts to watch — and which numbers deserve the dyno sheet.
“Tell me more, tell me more”
(“Summer Nights” from Grease)
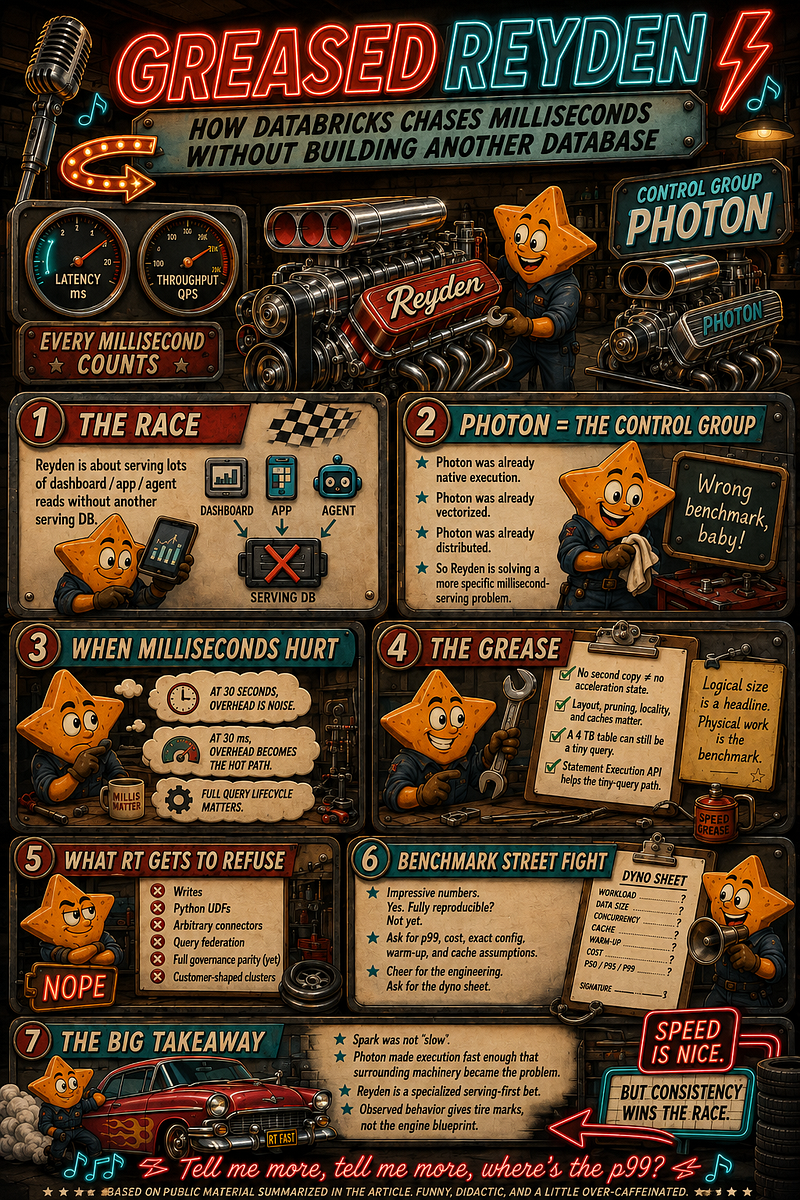
Greased Reyden: when Photon already made SQL fast, so Databricks popped the hood and started tuning the boring stuff until milliseconds began singing.
INTERACTIVE EXTRA
Greased Reyden: Data Highway
Take the Lakehouse Lightning down the Data Highway. Dodge silos, legacy ETL, NULLs and wildly confident agents.
Use the arrow keys or A/D to steer. On mobile, use the touch controls. Press Escape to leave full screen.