
Apache Spark WTF??? — I Like It When A Plan Comes Together (Part II)
Welcome back to another thrilling installment of our three-part deep dive into Spark execution plans!

“That’s what I’m after, tell me what I’m after.
(I’m after the goal to make the plan optimum)”
(adapted from “What I’m after” by Lords of the Underground)
Previously, On Apache Spark WTF …
In the first article, we explored a couple of ways to handle a derailed Spark execution plan:
- Using checkpoints or Save+Read — A quick fix, but with trade-offs: it impacts performance and stores intermediate data on disk.
- Disabling AQE (Adaptive Query Execution)— Another easy workaround, but at what cost? If some transformations benefit significantly from AQE, are we willing to sacrifice all those optimizations?
- Strategic caching — Not the easiest approach, but by far the most effective. Carefully deciding what and where to cache can lead us to a more optimal solution.
Setting Up The Environment
First things first — before we dive into our tests and investigations, we need to clone the GraphFrames repository and import it into our preferred IDE.
The problematic test suite that triggers the OutOfMemoryError can be found at: src/test/scala/org/graphframes/lib/ConnectedComponentsSuite.
Now, let’s get things set up. On Windows, Spark requires a few extra configuration steps to run properly:
- Set the
HADOOP_HOMEenvironment variable. - Update
java.library.pathto point to thebindirectory insideHADOOP_HOME.
Since Spark relies on the Hadoop API for filesystem access — and GraphFrames depends on checkpoints — this configuration ensures Spark can properly manage the checkpoint directory.
If we execute the test suite, something unexpected happens… it doesn’t fail! But why? 🤔
It turns out that another diligent GraphFrames contributor already applied a temporary fix: disabling AQE before running the test and re-enabling it afterward. And guess what? This isn’t the first time someone has used this exact hack to keep the test suite running.
While well-intentioned, this approach is merely a workaround — it sidesteps the actual problem rather than solving it. More importantly, an API should never modify an application’s global configuration, even temporarily. What if AQE is essential for computing the input edges and vertices DataFrames efficiently? By disabling AQE at this stage, we’re likely impacting not just this method’s transformations but potentially the entire execution plan.
Even more, what’s stopping us from running two Spark queries at the same time in two separate threads? Since AQE is a global configuration, disabling it in the ConnectedComponentsclass likely affectsall queries executed within the same Spark session. That means while one thread is running with AQE disabled, another part of our application — or even another unit test — could be unintentionally impacted.
Let’s revert ConnectedComponents.scala to its 2024 version. Now, when we rerun the test, the dreaded OutOfMemoryError resurfaces. And that’s exactly what we need—because now, we can finally dig into the real issue!
The Cursed Test
To save time and jump straight to our analysis, we can run only the failing test and skip the rest. The culprit? The “checkpoint interval” test, which examines how different checkpoint intervals impact the Connected Components algorithm in GraphFrames. It runs three cases:
- Interval = 0 ➜ No checkpoints. Boom! OutOfMemoryError. ❌
- Interval = 1 ➜ Checkpoints after every iteration. Works fine. ✅
- Interval = 10 ➜ Checkpoints every 10 iterations. Crash! Once again OutOfMemoryError. ❌
Each case runs the Connected Components algorithm on the same dataset. This algorithm is iterative, refining node labels until all nodes in the same connected group share the smallest node ID. It stops once labels stabilize, signaling full convergence. The number of iterations needed for convergence depends on the graph structure — denser graphs may stabilize faster, while sparse or large graphs may take longer.
Why does the third case fail despite checkpointing? With the data used in the test, the algorithm converges in the 3rd iteration, way after the 10th, so memory exhaustion occurs before reaching the checkpoint, leading to an OutOfMemoryError. Essentially, the heap fills up before Spark gets the chance to offload intermediate data and, more importantly, to break the lineage.
Here’s the twist: as I dug deeper into the issue, I noticed that increasing the number of shuffle partitions in GraphFrameTestSparkContext.scala fixed the issue entirely. By tweaking the spark.sql.shuffle.partitions config from its current value (4) to 10 or higher, all the test cases passed without a hitch.
Why? After spending far too long comparing execution plans for shuffle partitions 4 vs. 10, I realized the answer was embarrassingly simple: with 10, the algorithm converged before the dreaded 3rd iteration. Seriously, shame on me 😅.
Analyzing The run Method 🔍
Let’s take a closer look at the ConnectedComponents.run method—there are a few things worth noticing:
1] Counting for Logging
Before the iterative process begins, the edges DataFrame is persisted, and a count is performed solely to log the number of edges at the info level. Here’s the current code:
    var ee = g.edges.persist(intermediateStorageLevel) // src < dst
    val numEdges = ee.count()
    logInfo(s"$logPrefix Found $numEdges edges after preparation.")
The count is executed regardless of whether the log message is printed or not, which is usually the case since the default logging level is warn. But why not take advantage of Scala’s lazy evaluation?
Instead of forcing the count before checking the log level, we can do this:
logInfo(s"$logPrefix Found ${ee.count()} edges after preparation.")This way, the count is only performed if the info-level log message is actually printed. If the message doesn’t get logged, the count is never executed — saving unnecessary computation.
2] Persisting Everywhere
There are two persist calls before the loop starts and four more within each iteration. All the persisted DataFrames from the last and current rounds are stored in two sequence variables, which are later used to unpersist them.
While it’s not inherently bad practice to persist the data (in fact, it’s useful for improving performance in some cases), there’s a subtle issue: persisting doesn’t break the lineage.
Every time we persist a DataFrame, Spark still maintains the full lineage of how each field was computed. This means Spark must retain the entire execution plan, which keeps growing. As we discussed in the previous article, persisting a DataFrame can sometimes prevent Spark from optimizing and shortening the execution plan. So, while persistence is helpful for performance, it can also limit Spark’s ability to apply some of its more powerful optimizations.
3] Use of RDD API
In the _calcMinNbrSum method, the code uses the RDD API for calculating the total sum of edge src IDs:
val (minNbrSum, cnt) = minNbrsDF.select(sum(col(MIN_NBR).cast(DecimalType(20, 0))), count("*")).rdd
  .map { r =>
    (r.getAs[BigDecimal](0), r.getLong(1))
  }.first()
Switching from DataFrames to RDDs comes with several potential drawbacks:
- Performance Loss: DataFrame-based operations benefit from query optimization, which is lost when we drop down to RDDs.
- Higher Operational Costs: RDDs often lead to inefficient execution, higher memory usage, and potentially excessive computation.
- Increased Maintenance Complexity: The code becomes harder to maintain when we rely on the lower-level RDD API.
In this case, the calculation is straightforward, so using RDDs seems to complicate things unnecessarily. The same result can be achieved with DataFrame operations:
val row = minNbrsDF.select(
  sum(col(MIN_NBR).cast(DecimalType(20, 0))).as("sum"),
  count("*").as("count")
).first()

val minNbrSum = row.getAs[BigDecimal]("sum")
val cnt = row.getAs[Long]("count")
Switching to this DataFrame-based approach would not only not improve the execution of our plan, but it actually makes things worse.
The real culprit here is … surprise, surprise —Adaptive Query Execution (AQE). The more we “feed” AQE with DataFrame transformations, the more bloated the plan becomes, and the longer Spark takes to do… well, whatever the heck it’s internally doing (we’ll dive deeper into this in the next article).
4] Actions and More Actions
Without checkpoints, the algorithm executes several actions during each iteration of the loop:
- Total Sum of Edge
srcIDs Calculation: As discussed earlier, the_calcMinNbrSummethod collects the first row of the RDD to get the sum. This results in one action per iteration. - Skewed Joins: In a skewed join, hubs are keys with a disproportionately high number of records, leading to data skew and uneven workload distribution across partitions. The
skewedJoinmethod needs to collect the hubs to split the join into two types: a regular join (for keys that are not hubs or those exceeding thebroadcastThreshold) and a broadcast join (for hubs that don’t exceed the threshold). This adds two actions per iteration. - Materializing Persisted DataFrames: At the end of each iteration, the algorithm applies a
countaction on every persisted DataFrame to materialize it.
// materialize all persisted DataFrames in current round,
// then we can unpersist last round persisted DataFrames.
for (persisted_df <- currRoundPersistedDFs) {
  persisted_df.count()  // materialize it.
}
for (persisted_df <- lastRoundPersistedDFs) {
  persisted_df.unpersist()
}
Since there are 4 DataFrames added to the currRoundPersistedDFs sequence, 4 counts are performed here. So, in total, we have:
- 1 action for calculating the sum
- 2 actions for performing the skewed join
- 4 actions for materializing the persisted DataFrames
That’s 7 actions executed on different DataFrames per iteration. And remember — actions don’t break the lineage either, meaning Spark still has to track all the steps that led to each result.
5] No Real Checkpoints
Despite mentioning the word “checkpoint” extensively throughout the code, we’ll only find a call to the checkpoint method of a DataFrame in the Pregel.scala class. When GraphFrames “checkpoints”, what’s really doing is saving and loading the DataFrame into Parquet format which, if you read my previous article, you know that has much worse performance.
        // TODO: remove this after DataFrame.checkpoint is implemented
        val out = s"${checkpointDir.get}/$iteration"
        ee.write.parquet(out)
        // may hit S3 eventually consistent issue
        ee = spark.read.parquet(out)
It seems like the time never came to remove this snippet, but maybe now is the right moment to finally address it?
6] Garbage Collection Requests
The checkpoint code block makes calls to System.gc(). These calls act as a request to the JVM to perform garbage collection, which aims to free up memory by reclaiming unused objects. However, it doesn’t guarantee immediate execution and can introduce performance overhead if used unnecessarily.
Calling System.gc() is generally not a best practice, as it can disrupt the JVM’s garbage collection strategy and cause unwanted performance issues. Here’s the line in question:
System.gc() // hint Spark to clean shuffle directoriesThis line was introduced back in 2016 — more than 8 years ago. Perhaps Spark needed a hint back then, but in 2025, after several major updates, is this still necessary?
Is There Any Way To Improve It?
Fixing the issues with the logged count and the checkpoint code block is straightforward. The persists are necessary because they prevent transformations from being executed again, and replacing the RDD part with its DataFrame equivalent isn’t an option due to our “hostilities” with AQE, so to speak.
Now, let’s dive back into the skewedJoin method. This method was designed to optimize joins by addressing data skew:
- For keys that appear frequently (hubs), the smaller DataFrame is broadcasted to all nodes, minimizing shuffle operations.
- For non-skewed keys, a regular join is performed.
The result is a combined DataFrame from both types of joins. This method was initially a good way to improve performance when certain join keys are much more frequent than others, as it avoids inefficient shuffling and large data movement across the cluster.
But here’s the catch: hubs don’t always occur, and this results in penalties regardless of the situation. Furthermore, Spark has evolved since this code was written back in 2016. At that time, AQE didn’t exist, but now that it does, this code is not only missing out on its benefits — it actively harms the execution plan due to its design.
Moreover, Spark now has built-in support for handling skewed joins more efficiently, specifically through the OptimizeSkewedJoin rule. This rule optimizes skewed joins to avoid tasks where data partitions are much larger than others (i.e., straggler tasks). It divides each skewed partition into smaller ones and replicates the corresponding matching partition on the other side of the join, allowing for parallel task execution. With this built-in optimization, Spark can automatically detect and handle skewed data, eliminating the need for custom partitioning or broadcasting.
So, what happens if we replace the skewedJoin implementation with a much simpler best-case scenario join? Something like this:
edges.join(minNbrs, SRC)This change avoids collecting the hubs, simplifies the plan significantly by reducing the number of steps — 1 collect, 5 filters, 2 joins, and 1 union are gone. However, this replacement doesn’t fix the issue, and the dreaded OOM still rears its head.
What else can we do? How about those final counts we mentioned earlier? Are they really necessary? If we comment out the loop where the currRoundPersistedDFs counts are performed, the test runs smoothly in under a minute and a half, consuming less than 2GB of heap. It behaves pretty similarly to disabling AQE—but without actually disabling AQE.
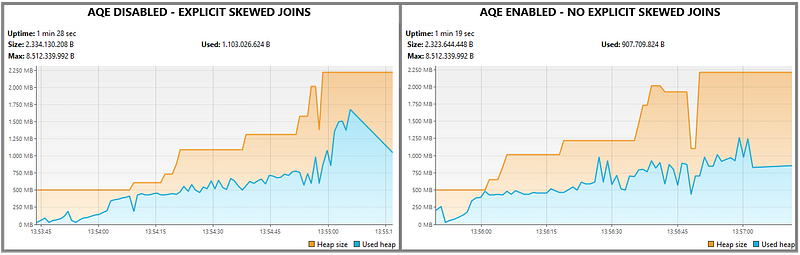
[AQE disabled+explicit skewed joins] VS [AQE enabled+no explicit skewed joins]
To PR Or Not To PR (aka Final Thoughts)
Am I confident that our workaround completely fixes this issue once and for all? Unfortunately, no. Am I certain that the fix doesn’t introduce new problems? Not really, because there’s still a chance that Spark might not handle skewed joins well, which could lead to issues down the line.
Maybe the best approach is to commit these changes as an optional feature or a new type of algorithm in the ConnectedComponentsfor GraphFrames users to decide. They could choose whether to disable AQE and use explicit skewed joins, or leave AQE enabled and let Spark try to handle skewed joins (if there are any) the best it can.
What do you think? If you have any thoughts or opinions on this, please drop a comment! I’d really appreciate hearing your perspective.
In this episode, we saw that attempting to fix the issue doesn’t take us too far. We can make it work, but it comes with the trade-off of introducing some uncertainty in the algorithm’s execution. So, ultimately, it’s up to the GraphFrames user to decide how to manage that uncertainty.
In the next episode, we’ll dive into why Spark is still being so troublesome and explore potential changes we could make to the Spark SQL module to definitively solve this problem. Trust me, you’ll be flabbergasted. No kidding.
“(I’m after the goal to make the plan optimum)
Heapdumps and threaddumps that’s what I’m after
(I’m after the goal to make the plan optimum)
A stack(trace) of that plan, that’s what I’m after”
(adapted from “What I’m after” by Lords of the Underground)
But heapdumps, threaddumps, and stacktraces … These juicy details will be unveiled in the third and final part of this mini-series!
You definitely don’t want to miss out! 😱👀